Introduction
If you’re reading this right now, I’m going to assume that you know what a pangenome is, but you don’t know the first thing about how to analyze one. Lucky for you, I had to do that very thing this past spring as part of the research leading up to my senior thesis. Having little to no bioinformatics background going in, I found the process to be long and laborious, and often found myself screaming obscenities at my computer screen. Out of the goodness of my heart, I have decided to save you, dear reader, many months of strife and anguish by writing this tutorial.
I will often refer to this tutorial written by the anvi’o programmers, which provides a good framework for the steps you need to take but makes the assumption that you know something about computer science and bioinformatics, and therefore skipped over steps that I was completely unaware of. I will not make that assumption, and at times you may wonder why I take the time to explain something that seems to be as basic as 2+2=4. However, to the untrained (in computer science) eye, the most basic of concepts may not be immediately obvious. My experience has taught me that if every single minute step is not explicitly stated, I will miss something that is vitally important and a simple task that should have taken no more than an hour will take at least three.
I hope that you find this tutorial to be complete and helpful. If you have any questions, comments, or concerns, please feel free to let me know!
Terminal
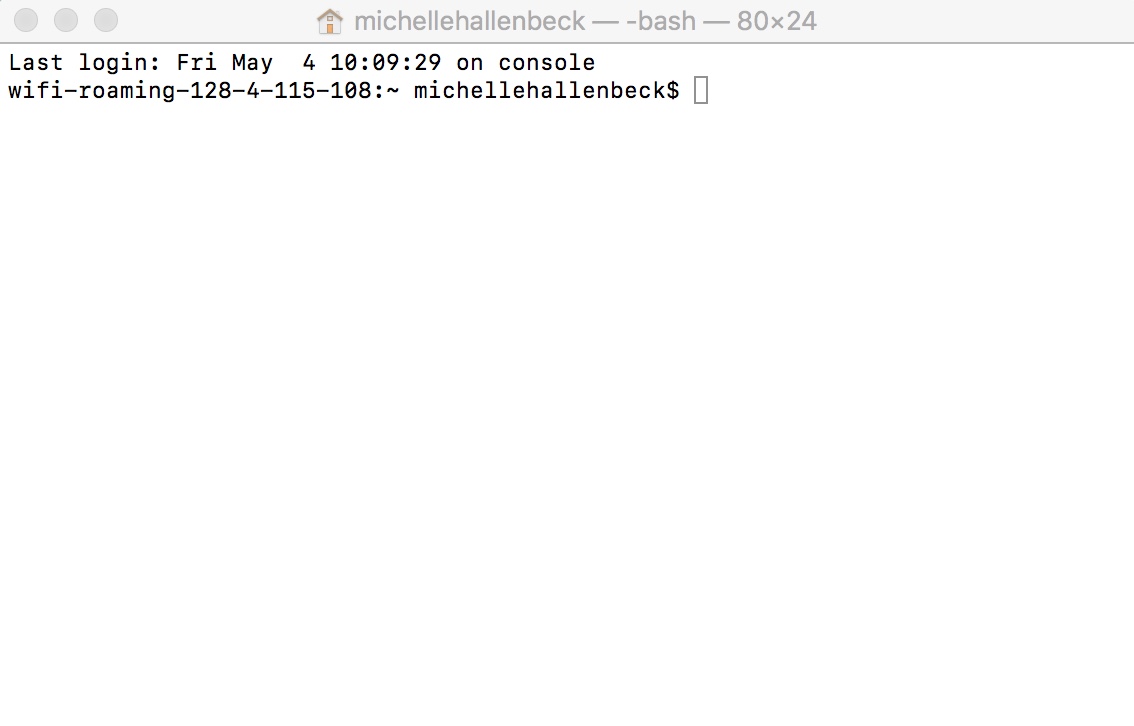
You will be doing everything in Terminal, which can be found on a Mac by pressing the F4 key (the one with six little squares arranged in 2 rows of 3), then clicking on ‘Other’. Terminal will be the black rectangle with ‘>_’ in white in the upper left corner. When you click on it, a window will pop up that looks like this:
Basic commands
Using terminal will require you to master some basic commands, including but not limited to: ls, cd, mv, cp, mkdir, and rm. I found this site very helpful, especially section 5: Manipulating Files. You should pay close attention to the ‘Wildcards’ section, which will be very helpful to you later when you are running ‘for loops’.
A note on terminology: ‘directory’ basically just means ‘folder’, and a directory can contain one or more files. You will be working with directories and files frequently throughout this tutorial, so it’s essential that you know how to use the relevant commands. If you find something in the above link to be insufficiently explained, let me know and I will restate it here in a more explicit fashion.
Installing anvi’o
There are many different ways to install anvi’o on your computer, instructions for all of which can be found here. I found the first section, ‘Painless installation with Homebrew’ to be easiest, so I recommend installing anvi’o that way. You should also make sure that you have Python 3 installed on your computer before you try to use anvi’o.
This was relatively simple to do on my own computer (which, by the way, is a Mac, so if you are not using a Mac, some things in this tutorial may or may not be different for you), but if you want to install anvi’o on biomix, the installation process will be long and agonizing (at least it was for me). The Homebrew installation will not work, so you will have to follow the instructions under ‘Installing the latest stable release (safe mode)’. The latest version of anvi’o at the time of this writing is v4.
If you don’t know what biomix is or have never heard of it, you can just ignore every mention of it in this tutorial. If you do know what biomix is, then you probably work at DBI, so until I graduate in the spring of 2019 you can just come find me if you have any questions about the biomix-specific portions of this tutorial (I work in the Chan lab on the first floor, and when I’m at DBI you can usually find me in the lab or in the bullpen).
Remember to run ‘anvi-self-test –suite mini‘ and ‘anvi-self-test –suite pangenomics‘ to make sure you have all your ducks in a row (in case you can’t tell, there are TWO dashes before the word ‘suite’ in both commands). Biomix people: when you run ‘anvi-self-test –suite pangenomics’, you have to stop the test once it gets to the part where it tries to display the pangenome (just type ‘exit’ or ‘end’, I don’t remember which).
Preparing your genomes for analysis
If the installation process has left you exhausted and with a permanent grudge against computers, don’t look for a respite here. You still have a long way to go before you can even conduct the actual pangenome analysis. There are several steps you have to take to get your genomes in the right format for anvi’o to be able to run a pangenome analysis on them.
External vs. internal genomes
The first thing we need to do is differentiate between external and internal genomes. External genomes are just the FASTA files of your genomes that you can download from NCBI or IMG or wherever. Internal genomes are what you get after you have been through anvi’o’s metagenomics workflow. If you have internal genomes, that means you have already been through that workflow and you already know more about how to use anvi’o than I do, so I’m not entirely sure what you’re doing reading a tutorial for beginners. I used only external genomes when I did this, so if you want to do this with internal genomes or a combination of internal and external genomes, I will point you to the not-for-beginners anvi’o pangenomics tutorial and what they say about that.
If you have external genomes, make sure that the file names all end in the same extension (might be .fna, .fa, or .faa, but make sure they all have the same one). Biomix people: you will need to copy your genomes onto biomix by using the command scp in the terminal window on your own computer. Example:
scp -r /Users/michellehallenbeck/Desktop/Thiomonas_genomes/ mkh@biomix.dbi.udel.edu:/home/mkh/Thiomonas_genomes/
You will need to provide the file path of your genomes folder, which is basically just where your genomes are located on your computer.
The -r parameter means ‘recursive’, and when you run this it will recursively copy everything in the folder you specified. It will prompt you for your biomix password.
Check your genomes for completion
The next step is to run the program CheckM on your genomes to make sure they are sufficiently complete. This is not required, but I highly recommend it nonetheless, because there’s not much point in running a pangenome analysis on genomes that are only 20-30% complete. I used a cutoff of 70% complete for my analysis, but this is a purely arbitrary boundary and not a particularly strict one. You can choose whatever minimum percent completion makes sense to you.
You will obviously have to download CheckM in order to run it (unless you are using biomix, which already has CheckM installed). You can do that from the link above.
Note that CheckM assumes that your files all end in the extension .fna, so if your genome files don’t have that extension you will have to specify whichever extension it is you are using by typing -x followed by the three-letter extension (without the period before it).
Biomix people: you will need to start an interactive job before running CheckM (or before running anything else, for that matter). See ‘Interactive SLURM job’ under the link in the previous sentence for more details on the different parameters. This is what I ran every time I needed to start an interactive job:
srun -N 1 -c 12 –mem=316000 –partition=batch –pty bash
To run CheckM on your genomes:
checkm lineage_wf Thiomonas_genomes/ Thiomonas_CheckM_output/
‘Thiomonas_genomes/’ represents the folder containing your FASTA files, and ‘Thiomonas_CheckM_output/’ represents the folder in which CheckM will place the results you got from running it. CheckM will create this folder for you, so don’t make it yourself before running CheckM. You will have to tell CheckM the name of the folder you want it to place its output in.
Once you have run CheckM and know how complete your genomes are, you might decide that some of them are not complete enough for your liking. I found it easiest to create a new folder within my genomes folder and move the not-complete-enough genomes into that folder using the following set of commands:
cd Thiomonas_genomes/
mkdir not_used/
mv file_1 file_2 not_used/
The first of those commands allows you to enter your genomes folder, the second creates the new folder that you want to move your incomplete genomes to, and the third actually moves those genomes into the new folder.
Generate contigs databases
Now we finally get to start using anvi’o! In this step, you will convert each of your FASTA files into an anvi’o contigs database by running the command anvi-gen-contigs-database. For this command and all other anvi’o commands, you can find out more about it and the parameters they require by typing the name of the command followed by -h or –help.
Depending on how many genomes you have, you may or may not find it tedious to run anvi-gen-contigs-database on each of them one by one. For the sake of convenience, I recommend that you run a ‘for loop’ to take care of all your genomes with a single command:
for f in *.fna; do anvi-gen-contigs-database — contigs-fasta $f –project-name THIOMONAS_GENOMES –output-db-path /home/mkh/Thiomonas_genomes/${f}_out.db; done
This will convert each of your genomes into an anvi’o contigs database one by one, but without the tediousness of running the same command 20+ times. Just type the for loop, hit enter, and sit back and let anvi’o work its magic.
Remember to first enter the folder containing your genomes before running any commands on them by typing cd followed by the name of the folder with a backslash:
cd Thiomonas_genomes/
Then you will be able to specify all of the files in that folder that end in .fna by ‘*.fna’. The ‘f’ in ‘for f in *.fna’ is a variable that refers to all of the characters in the file name before the ending ‘.fna’. The for loop will then run the command ‘anvi-gen-contigs-databases’ on every file in the folder that ends in ‘.fna’.
At this point, anvi’o may give you the following error:
Config Error: At least one of the deflines in your FASTA File does not comply with the ‘simple deflines’ requirement of anvi’o. You can either use the script `anvi-script-reformat-fasta` to take care of this issue, or read this section in the tutorial to understand the reason behind this requirement (anvi’o is very upset for making you do this): http://merenlab.org/2016/06/22/anvio-tutorial-v2/#take-a-look-at-your-fasta-file
This means that the headers in your FASTA files have spaces or illegal characters. The header is the identifier at the front of each sequence, like so:
A fasta file =
>header
ATCG…
>header2
ATTC…
>header3
GGGC…
You can fix this by running anvi-script-reformat-fasta:
for f in *.fna; do anvi-script-reformat-fasta –output-file ${f} _cleanedheaders –simplify-names $f; done
This will create a bunch of FASTA files that all end in ‘.fna_cleanedheaders’.
When you run anvi-gen-contigs-database again after fixing your headers, you will need to take this into account:
for f in *.fna_cleanedheaders; do anvi-gen-contigs-database — contigs-fasta $f –project-name THIOMONAS_GENOMES –output- db-path /home/mkh/Thiomonas_genomes/${f}_out.db; done
This will create a bunch of files in your genomes folder that end in ‘.fna_cleanedheaders_out.db’. These are your contigs databases.
Once you have your contigs databases, it’s a good idea to annotate them using anvi-run-ncbi-cogs and anvi-run-hmms, so that when you’re looking at your pangenome later, it actually holds some meaning and you’re not just looking at a bunch of sequences with no indication of what they actually do. You can do this with for loops:
for f in *.db; do anvi-run-ncbi-cogs –contigs-db $f –num-threads 12 –search-with blastp; done
for f in *.db; do anvi-run-hmms –contigs-db $f –num-threads 16; done
Make sure you run ‘anvi-setup-ncbi-cogs’ before you run the first of those. Just type ‘anvi-setup-ncbi-cogs’ into your terminal and you’ll be good to go.
A note on threads: the parameter –num-threads is very important, as the number of threads you choose to use will determine how long your command will take to run. Too few and your command will take the better part of a day; too many and it will crash because you’ve exceeded the capacity of your computer. Basically, each computer has a certain number of cores, and each core has two threads.
I found 16 threads to be optimal, but it may be different for you. I was also using biomix, so I had access to more resources than just what my computer has. If you have a Mac, you can find out how many cores you have by clicking on the apple symbol in the upper left corner, then ‘About This Mac’, then ‘System Report’.
Generate a genomes storage
Now you’re going to take your contigs databases and put them in a genomes storage. This will require you to make a tab-delimited text file listing your contigs databases and their file paths.
The file path is basically just where your file is located, from broad to narrow. For example, if you have been putting everything on your desktop, the file path for one of your contigs databases might look like this:
/Users/michellehallenbeck/Desktop/Thiomonas_genomes/Thiomonas_sp_FB_6.fna_cleanedheaders_out.db
Or if you have been doing everything in biomix:
/home/mkh/Thiomonas_genomes/Thiomonas_sp_FB_6.fna_cleanedheaders_out.db
You can make the text file by first creating an Excel file with two columns: one with the name of your genome, and one with the file path of the corresponding contigs database. Then you just save it as a tab-delimited text file.
If you have internal genomes, you will need to create a separate file for your internal genomes and their file paths, and when you run anvi-gen-genomes-storage you will need to add the flag –internal-genomes followed by the file path of your internal genomes text file.
Biomix people: you will need to copy your text file onto biomix:
scp /Users/michellehallenbeck/Desktop/Thiomonas_contigs_databases.txt mkh@biomix.dbi.udel.edu:/home/mkh/Thiomonas_genomes/
To generate the genomes storage:
anvi-gen-genomes-storage –external-genomes /home/mkh/Thiomonas_genomes/Thiomonas_contigs_databases.txt –output-file /home/mkh/Thiomonas_genomes/THIOMONAS-GENOMES.db
This will create a file ending in ‘-GENOMES.db’. If you run anvi-gen-genomes-storage -h, you will see that it tells you the output file (your genomes storage) has to end in ‘-GENOMES.db’.
Running the pangenome analysis
At long last, we arrive at the actual pangenome analysis. This will be accomplished with the command anvi-pan-genome:
anvi-pan-genome –genomes-storage THIOMONAS-GENOMES.db –project-name THIOMONAS –output-dir /home/mkh/Thiomonas_genomes/ –num-threads 16 –use-ncbi-blast –mcl-inflation 8
The workflow provided by the anvi’o developers actually takes the time to go through each of the parameters of this command, and you can also run anvi-pan-genome -h to learn more about them. At minimum, you will need to provide anvi’o with the name of your genomes storage (no file path this time), the name of the project (whatever you choose), and a file path for the output directory, so that anvi’o knows where to put the results of the pangenome analysis. A new folder containing the results will be created for you; the file path is only telling anvi’o where you want it to put that folder.
Depending on the specific question you are trying to answer, you may want to play around with the other parameters a bit. For example, the –mcl-inflation parameter affects the sensitivity of the program when it is defining gene clusters. The Meren lab recommends using a value of 2 (the default) when comparing distantly related genomes and 10 when comparing very closely related genomes. I chose to use a value of 8, but that was a judgement call on my part; you should use whatever value makes the most sense to you.
You can use either DIAMOND or NCBI blastp for protein search during the analysis. The default is DIAMOND in fast mode; obviously if you don’t have DIAMOND installed, you will need to either install it or use the flag –use-ncbi-blast when you run your pangenome analysis. If you are using DIAMOND, you can instruct it to be sensitive by using the flag –sensitive. It will take longer this way, but it will probably be more accurate.
The –num-threads parameter is also very important here. I used 16 threads when running my analysis, and it took between 2-3 hours. Again, you should check to make sure how many threads you can actually use before you start running anything.
I didn’t alter any of the other parameters when I ran my analysis either because they didn’t apply to the question I was trying to answer or because I wasn’t sure what they meant. If you aren’t sure what one of the optional parameters signifies, my advice would be not to touch it. You can always run the analysis again with different parameters if you want to experiment or if something went wrong the first time.
Viewing your pangenome
Once you have run your pangenome analysis, you can look at your results with the command anvi-display-pan.
If you have been using biomix up until this point, you need to get off it and do the rest of this tutorial on your own computer. The anvi-display-pan command requires both the pangenome you just created and your genomes storage, so you need to copy both of them onto your own computer from biomix (log out of biomix before typing the following commands):
scp -r mkh@biomix.dbi.udel.edu:/home/mkh/Thiomonas_genomes/Thiomonas_pangenome/ /Users/michellehallenbeck/Desktop/
scp mkh@biomix.dbi.udel.edu:/home/mkh/Thiomonas_genomes/THIOMONAS-GENOMES.db /Users/michellehallenbeck/Desktop/
The first time you run the anvi-display-pan command, it will look like this:
anvi-display-pan –pan-db /Users/michellehallenbeck/Desktop/Thiomonas_pangenome/THIOMONAS-PAN.db –genomes-storage /Users/michellehallenbeck/Desktop/THIOMONAS-GENOMES.db –title ThiomonasPangenome
You will see something that looks like this:
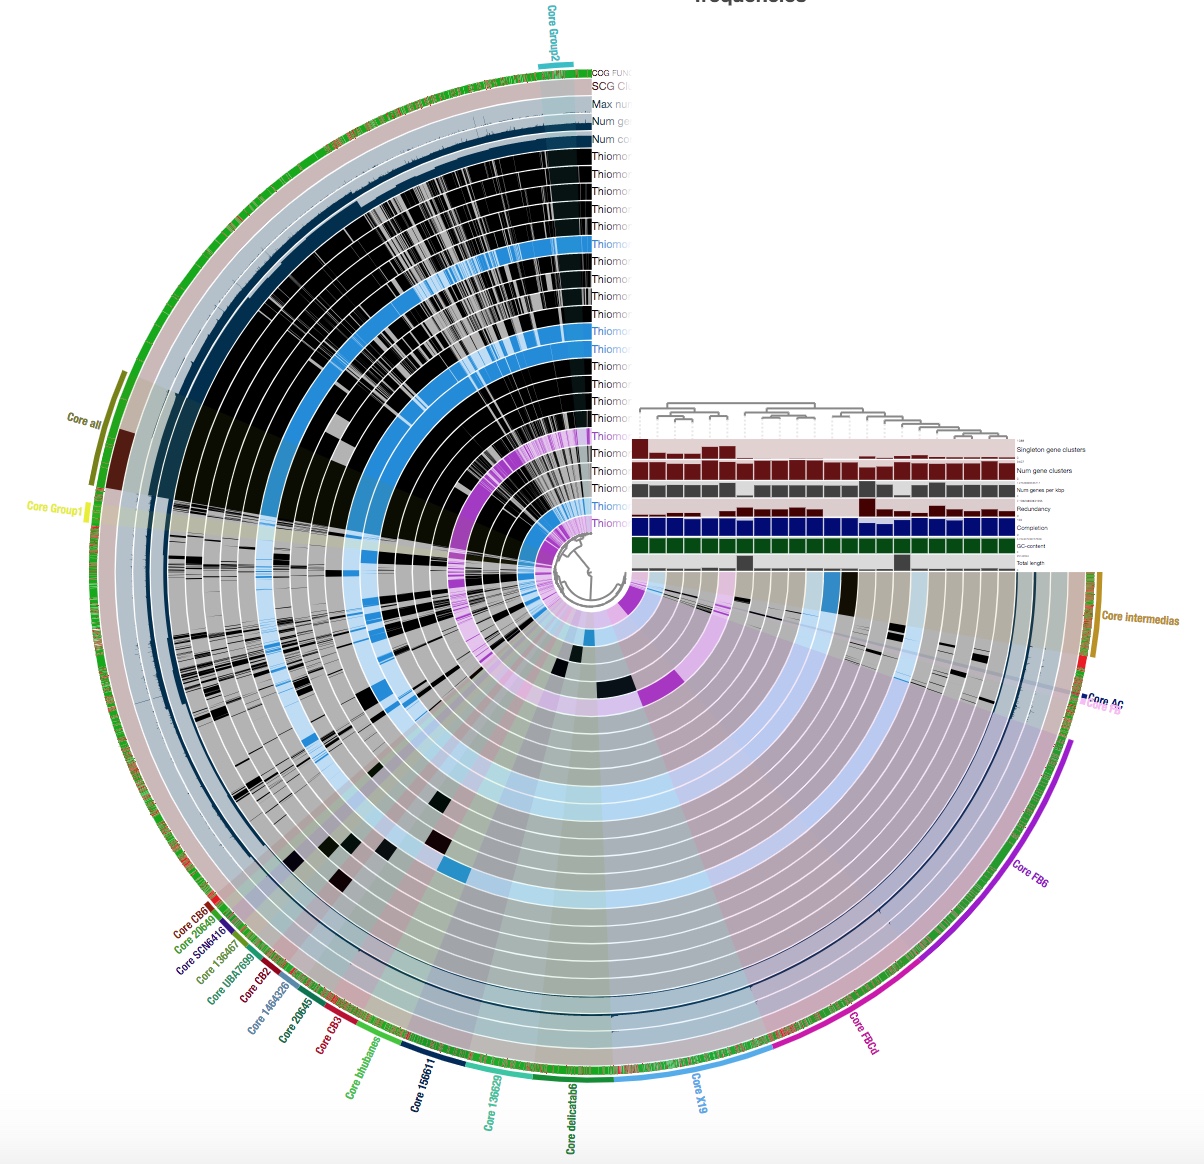
This is not how my pangenome looked when I first displayed it; this is after I played around with the interface a bit and grouped my gene clusters into bins.
A ‘bin’ can be thought of as a box of gene clusters that can be found in a certain subset, or all, of your genomes. A gene cluster basically consists of all of the copies of a gene that are in a pangenome. You should group as many of your gene clusters as you can into bins; you will be grateful for this later when you summarize your pangenome.
You should play around with the interface and the different ways of displaying your results until you find an arrangement that works best for you. I found it best to go to the ‘Samples’ tab under the ‘Settings’ panel on the left, going to ‘sample order’, and selecting ‘gene_cluster frequencies’:

This will organize your genomes based on gene clustering results and makes it easier to see which gene clusters should be grouped into bins. You can also change the colors of your bins and of your genomes in the ‘Settings’ panel as well.
When you are playing around with the interface, you can save the state your display is in at the present moment by going to the ‘Settings’ panel. You should be in the ‘Main’ tab, and there should be a ‘save state’ button:
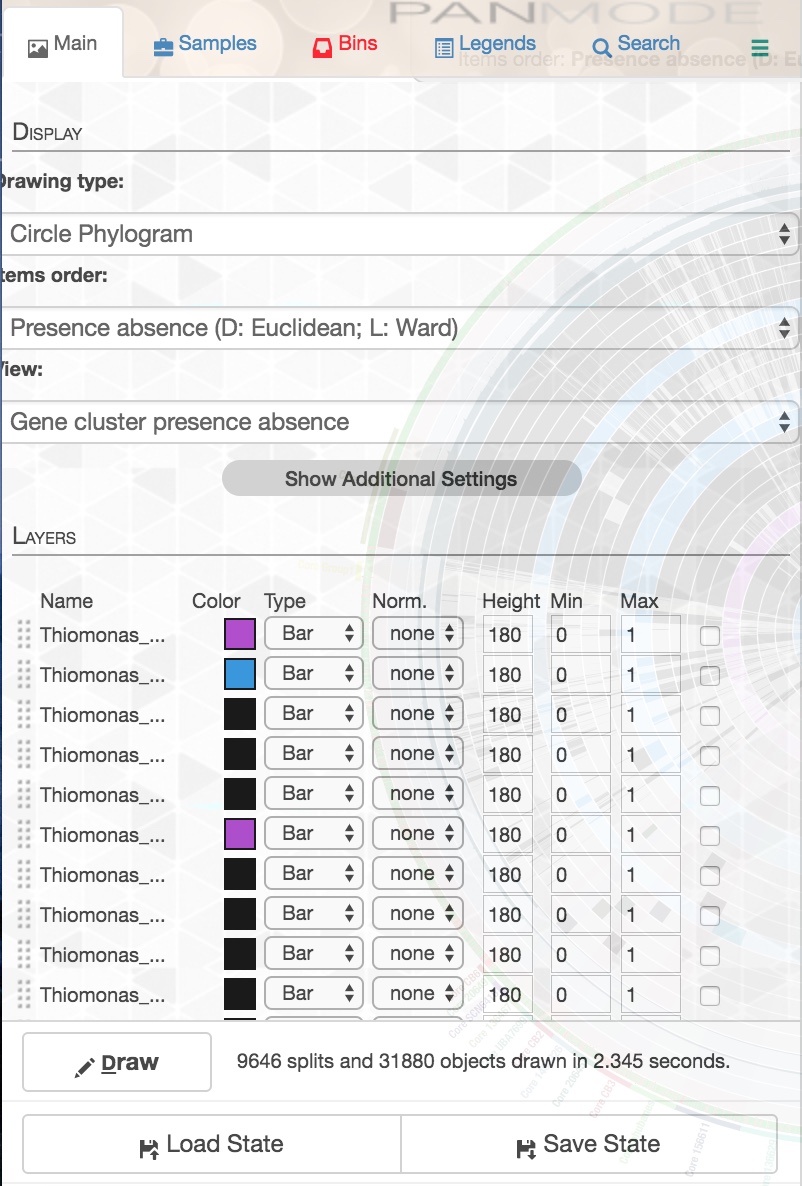
You can overwrite your previous save, or give it a new name. Every time you display your pangenome thereafter, you can specify which state you want to load with the parameter –state-autoload followed by the name of the state.
If you want to inspect any of your gene clusters, right click on it and select ‘Inspect gene cluster’. You will see a bunch of amino acid sequences, in the same order as they appear in the display. To view function annotations, just click on one of the sequences and you will see its function annotation.
To make a bin, first create the bin by going to the ‘Settings’ panel and clicking on ‘Bins’:
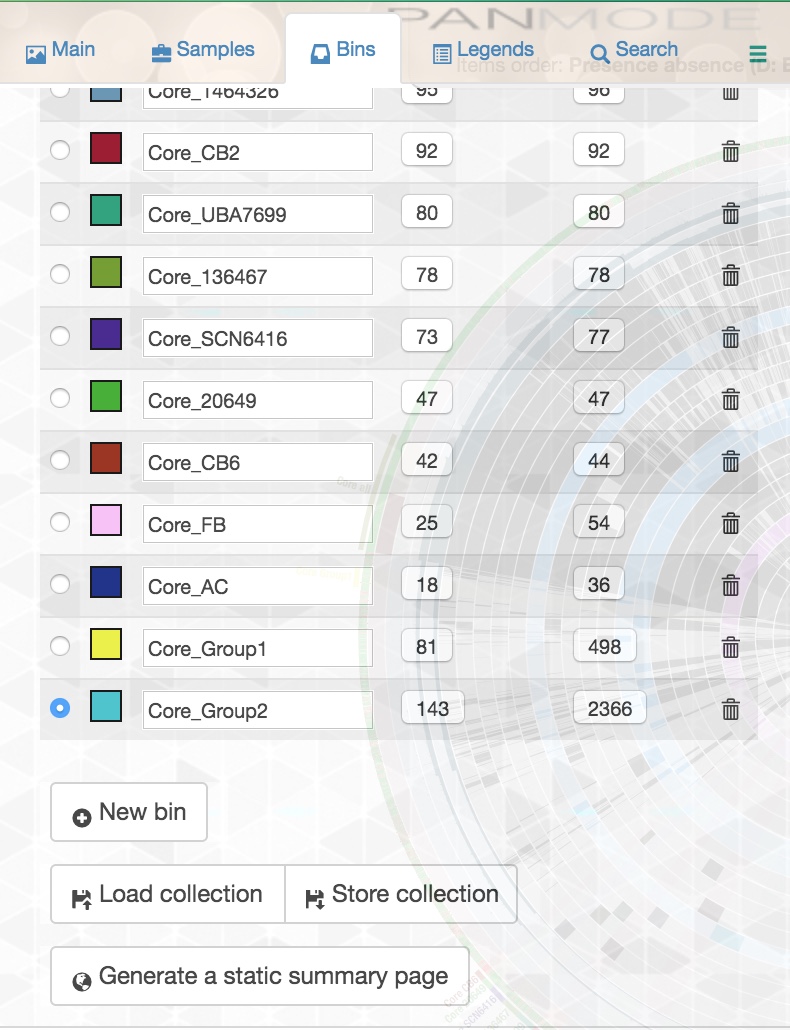
You can create as many bins as you want and name them whatever you wish. Make sure you have selected the bin you want to add gene clusters to, and while this panel is open, zoom in on the tree in the middle of your display. When you move your mouse over the tree, you will see that you can make different selections from the tree, and a certain slice of your pangenome will be selected depending on where you are in the tree. Once your mouse is over the selection you want, click once and the gene clusters in your selection will be added to whichever bin you selected in the left panel.
Be very careful with this! If you inadvertently click on a gene cluster when you are trying to double click, you may accidentally add that gene cluster to a bin you didn’t intend to add it to. That’s why I recommend that every time you have made a bin that you actually want, you save it by clicking the ‘store collection’ button in the ‘Bins’ panel. This will save all of the bins you have at that point. You can overwrite your previous save, or change the name of your collection so that you have saved the different steps of your bin-making process.
When you subsequently view your pangenome again, you can specify which bins you want to see in your interface with the parameter –collection-autoload followed by the name of your desired bin collection.
Summarizing your pangenome
Once you are done binning your gene clusters and your pangenome looks as pretty as you can make it, you can summarize your results with the command anvi-summarize:
anvi-summarize –pan-or-profile-db /Users/michellehallenbeck/Desktop/Thiomonas_pangenome/THIOMONAS-PAN.db –genomes-storage /Users/michellehallenbeck/Desktop/THIOMONAS-GENOMES.db –collection-name default –output-dir /Users/michellehallenbeck/Desktop/PAN-SUMMARY
As with anvi-display-pan, you need to specify the file paths of your pangenome and your genomes storage. You also need to specify the folder in which you want anvi’o to place the summary files.
You must name this folder yourself!!! Do not, I repeat, DO NOT just specify the file path where you want anvi’o to place the new folder without naming the new folder itself and run the command, because it will overwrite (meaning delete) everything in the area you have specified. I made this mistake the first time I ran anvi-summarize, and anvi’o deleted all the bins that I had spent many painstaking hours making. Fortunately, I had backed up everything to an external hard drive not more than an hour before, so in the end I didn’t lose all my hard work. You’re welcome for the warning.
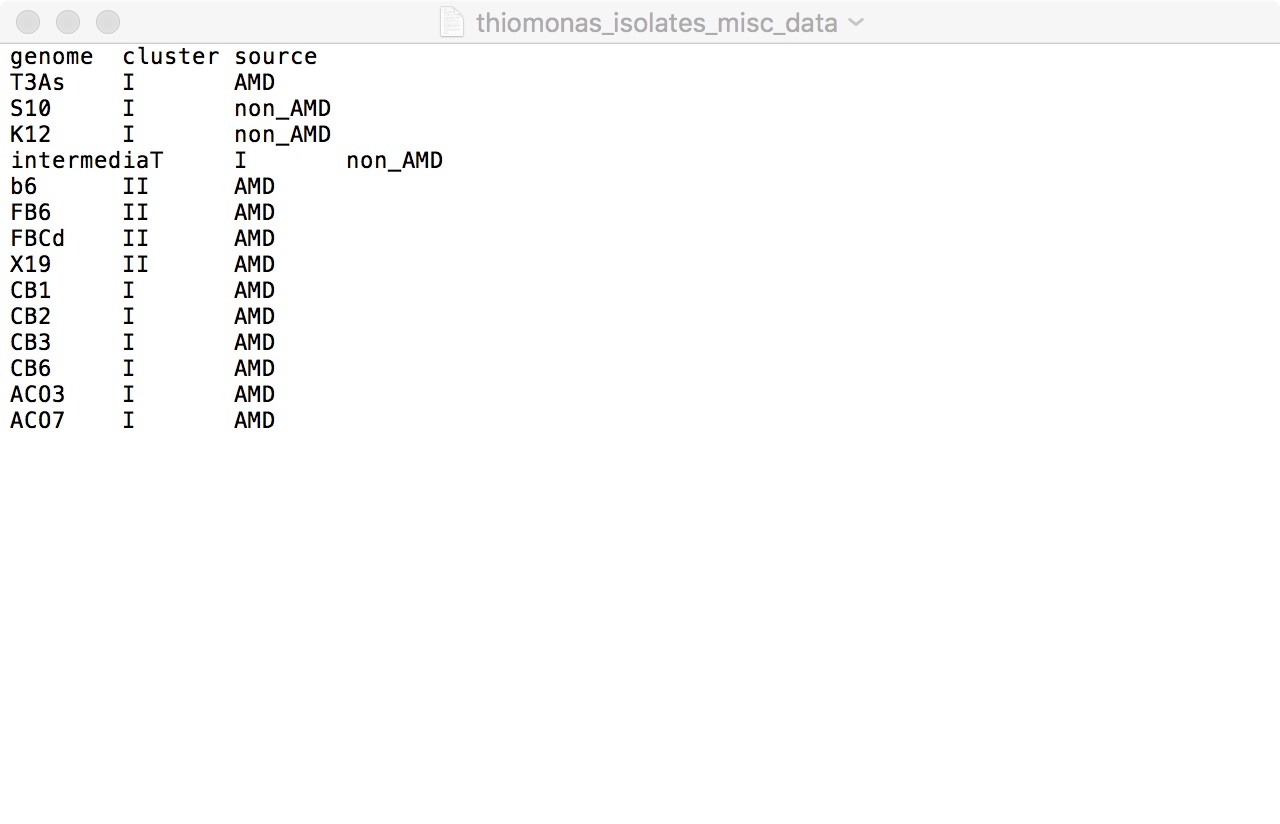
The output of the anvi-summarize command consists of a static html page that opens in Google Chrome and summarizes the details of your pangenome, and a text file listing your gene clusters, their genomes, their bins, and function annotations. I found it convenient to save the text file as an Excel file, for ease of reading and organizing the gene clusters by bin (using the filter function in Excel).
Conclusion
I hope you have had fun on this little adventure. If you have any questions, comments, or concerns regarding any part of this tutorial, please feel free to leave a comment!